View a Usage Summary Report chart
To see how much data is backed up for computers in a site, Admin users and Support users can view and configure a Usage Summary Report chart. The chart also shows activities that affect vault space usage (e.g., backup job changes).
The Original Size chart view of the Usage Summary Report shows the amount of data backed up for computers in a site before the data is compressed.
In some Portal instances, a Compressed Size chart view also appears. This chart shows the amount of data backed up for computers in a site after the data was compressed.
The amount of data backed up in a site can also be viewed in the Usage Summary Report table view. See Usage Summary Report.
Note: You cannot export or email data from a Usage Summary Report chart. You can only export or email data from the Usage Summary table view.
To view a Usage Summary Report chart:
-
When signed in as an Admin user or Support user, click Reports on the navigation bar.
The Reports page lists default and customized report views.
If you are signed in as a Support user, and the Support Dashboard appears on the Reports page, you need to select a site.
-
In the Usage Summary Report section, click a chart view.
Chart View (Original Size) shows the amount of data backed up for computers and environments in a site before the data was compressed.
In some Portal instances, Chart View (Compressed Size) is also available. This chart view shows the amount of data backed up for computers and environments in a site after the data was compressed.
The vertical axis scale and units change according to the amount of data. The vertical axis does not start at zero (0).
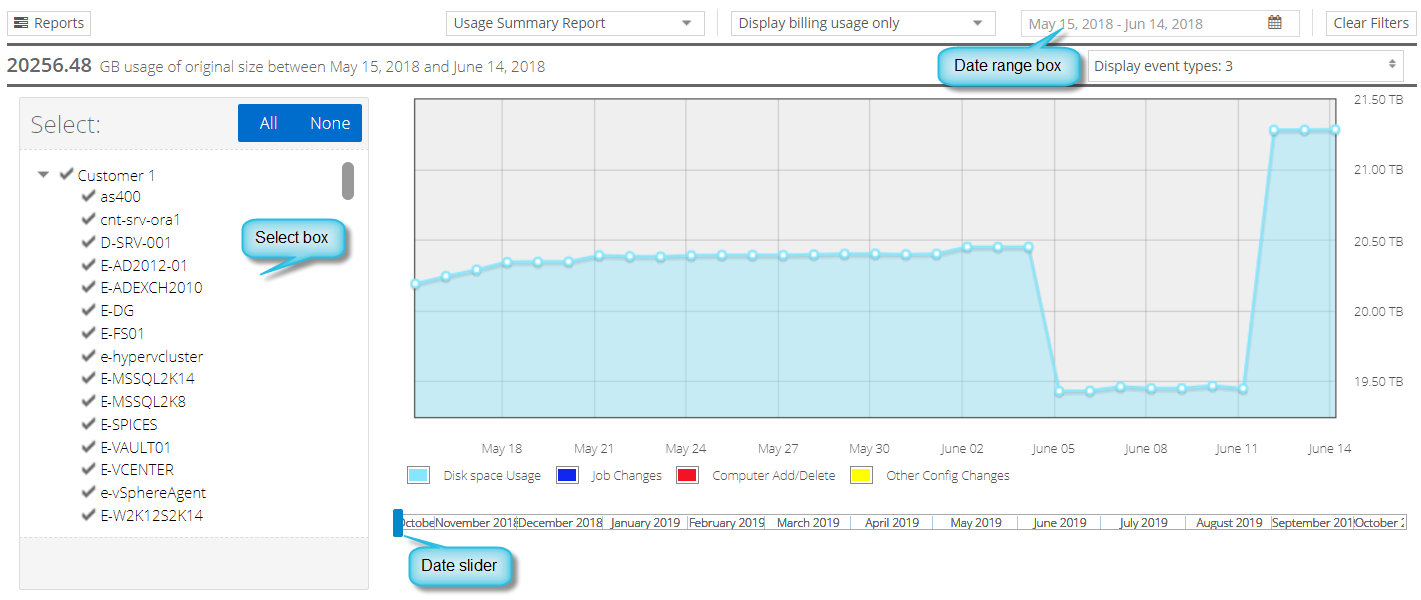
In the Select box, a check mark appears beside each item that is included in the chart. In some Portal instances, you can select vaults, sites and computers in the Select box. In other Portal instances, you can only select sites and computers, and data in the chart is combined across vaults for each site and computer.
-
To change which usage data is shown in the chart, do one or more of the following in the Select box, and then click Apply Filter:
- To exclude an item from the chart, click the item name to clear the check mark.
- To remove all items from the chart, click None. The check mark is cleared from every item name.
- To add an item to the chart, click the item name so that a check mark appears.
- To add all items to the chart, click All. A check mark appears beside every item name.
-
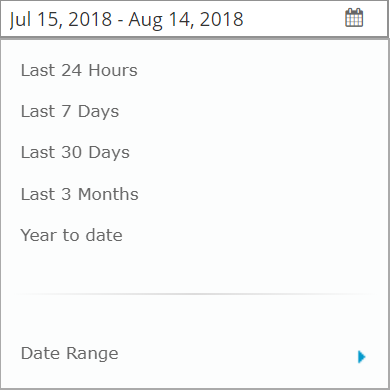
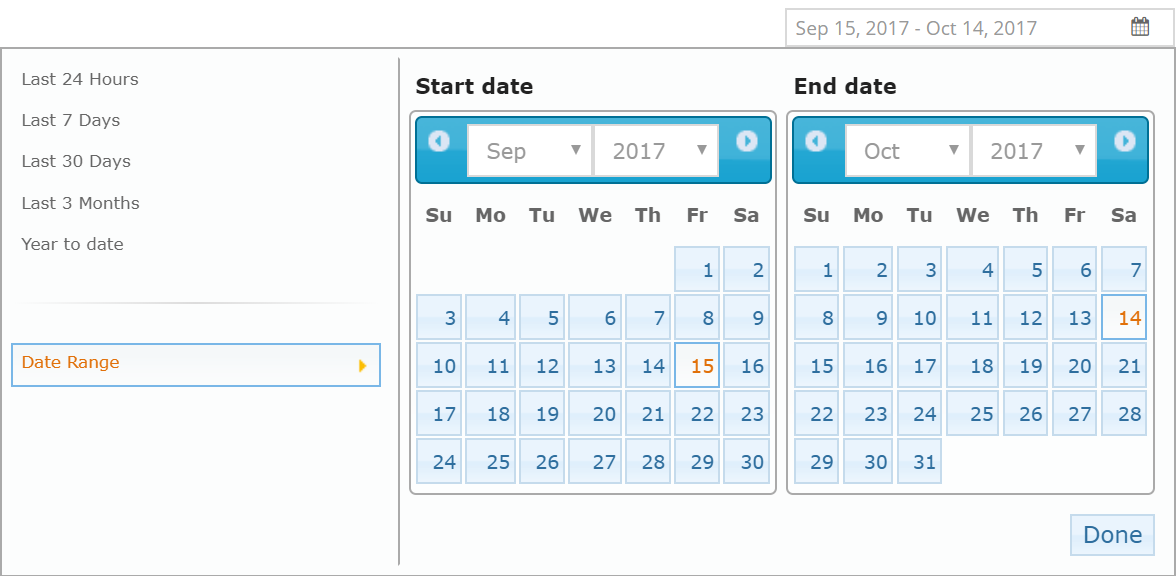
To change the chart date range, click the date range box. In the list that appears, do one of the following:
-
Click a predefined date range:
-
Last 24 Hours
-
Last 7 Days
-
Last 30 Days
-
Last 3 Months
-
Year to date
-
-
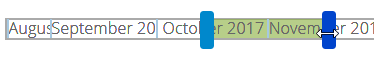
In the date slider below the chart, drag the date range start and end markers to change the selected date range.
-
Click Date Range, and specify a custom date range. In the Start date calendar, click the first day of records to include in the report. In the End date calendar, click the last day of records to include in the report. Click Done.
-
-
If a Display usage box appears beside the date range box above the chart, do one of the following:
- To only show billable storage usage in the chart, click Display billing usage only.
-
To include both billable and non-billable storage usage in the chart, click Display all usage.
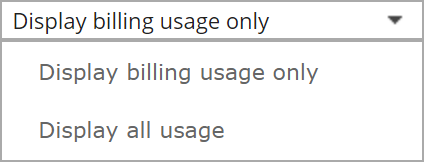
Note: The Display usage box only appears in Portal instances where the Compressed Usage chart is available.
-
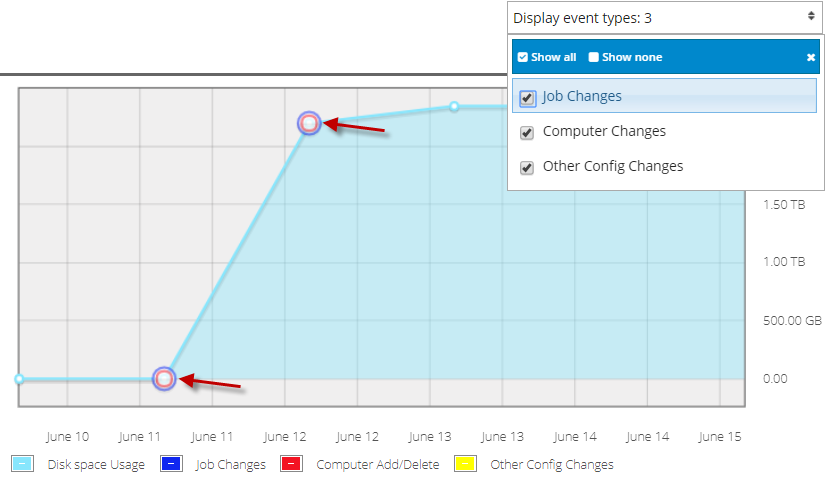
To view additional information on the chart, click the Display event types box. In the list, do one or more of the following:
- To view job changes, mark the Job Changes check box.
- To view computer changes, mark the Computer Changes check box.
- To view other configuration changes, mark the Other Config Changes check box.
- To only view vault space usage on the chart, mark the Show none check box.
- To view job changes, computer changes, and other configuration changes, mark the Show all check box.
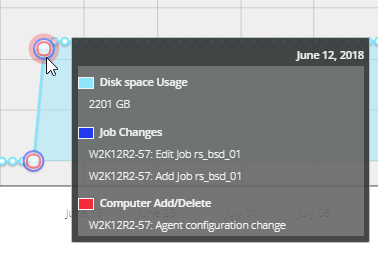
A circle appears on the chart for each event type that is marked in the list.
-
To view precise information about vault disk space usage and any displayed event types on a particular date, click the dot for the date on the chart.
A box shows the amount of disk space used on the vault, and detailed information about any displayed event types.